| Outreach: Public Relations | 5 Media coverage |
| Awareness: Social Media Ads | 91,577 Reach 172,474 Impressions 188% impression rate |
| Engagement: Web Page Landing | ~X,000 |
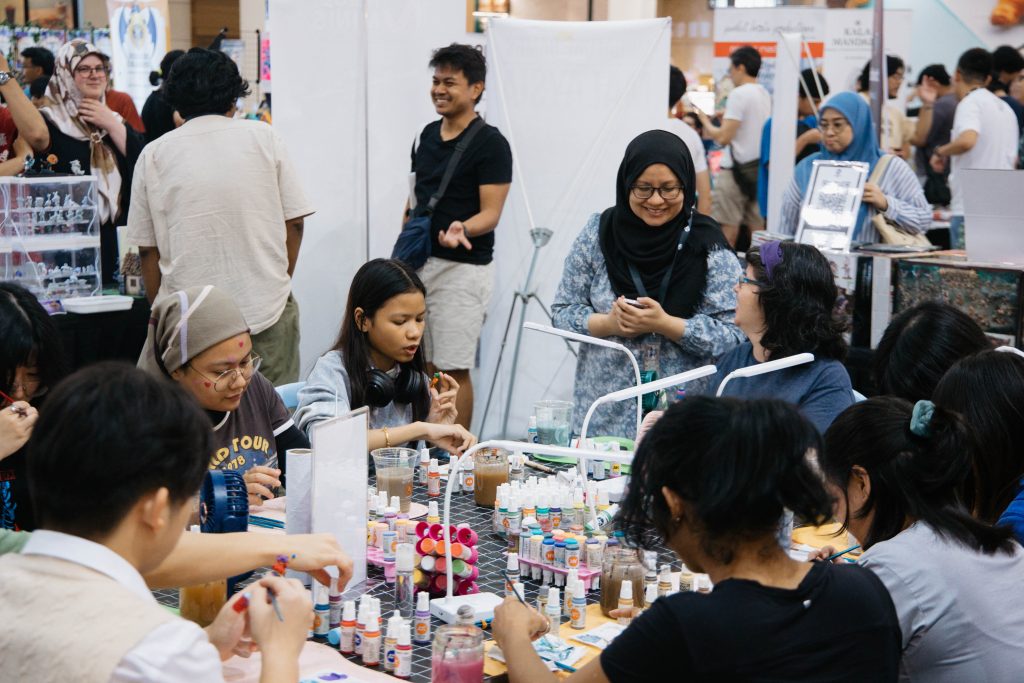
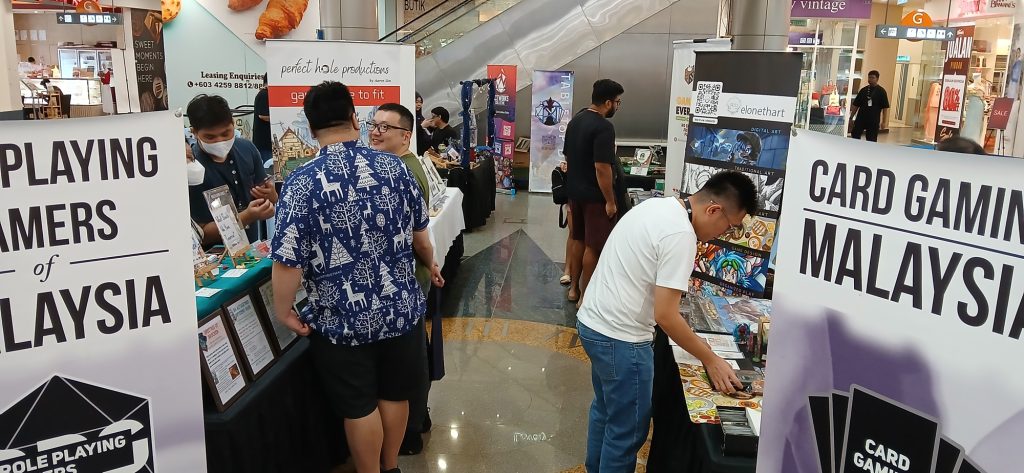
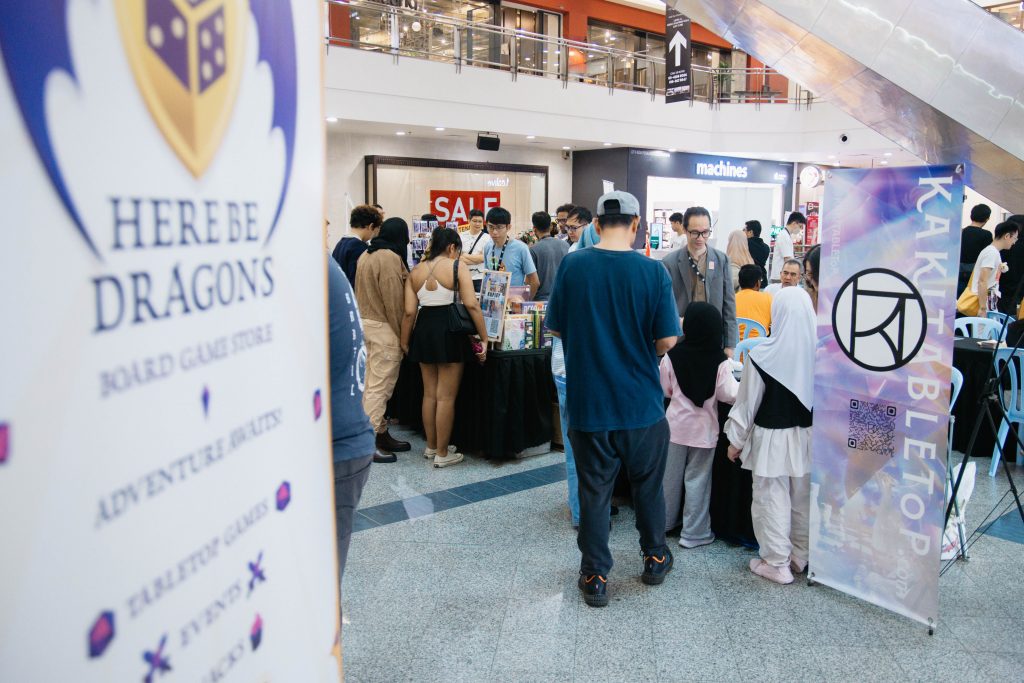
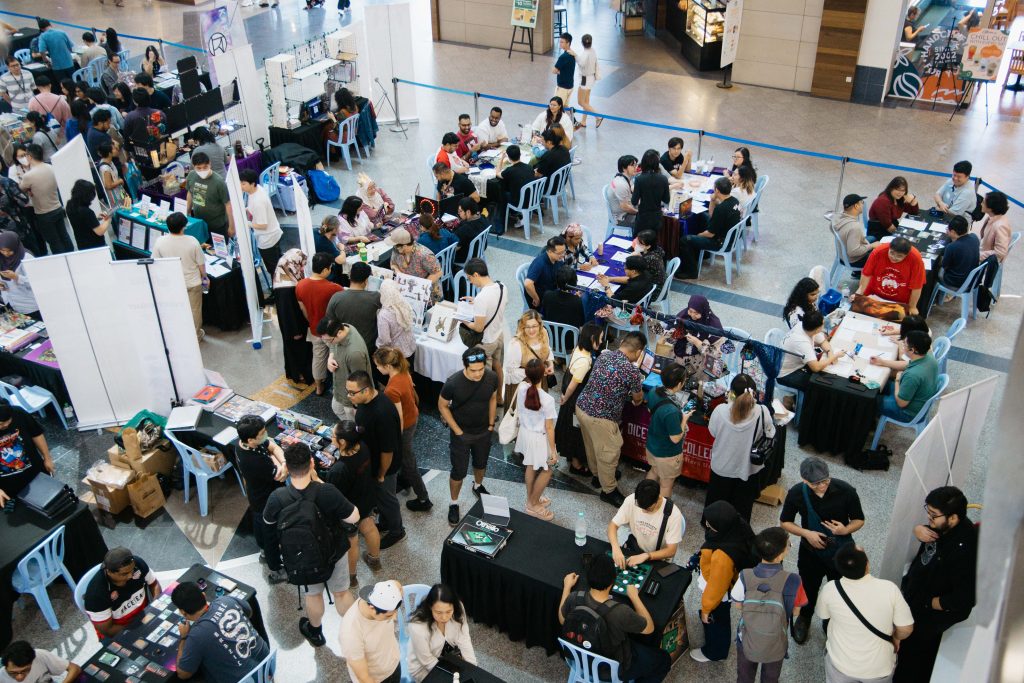
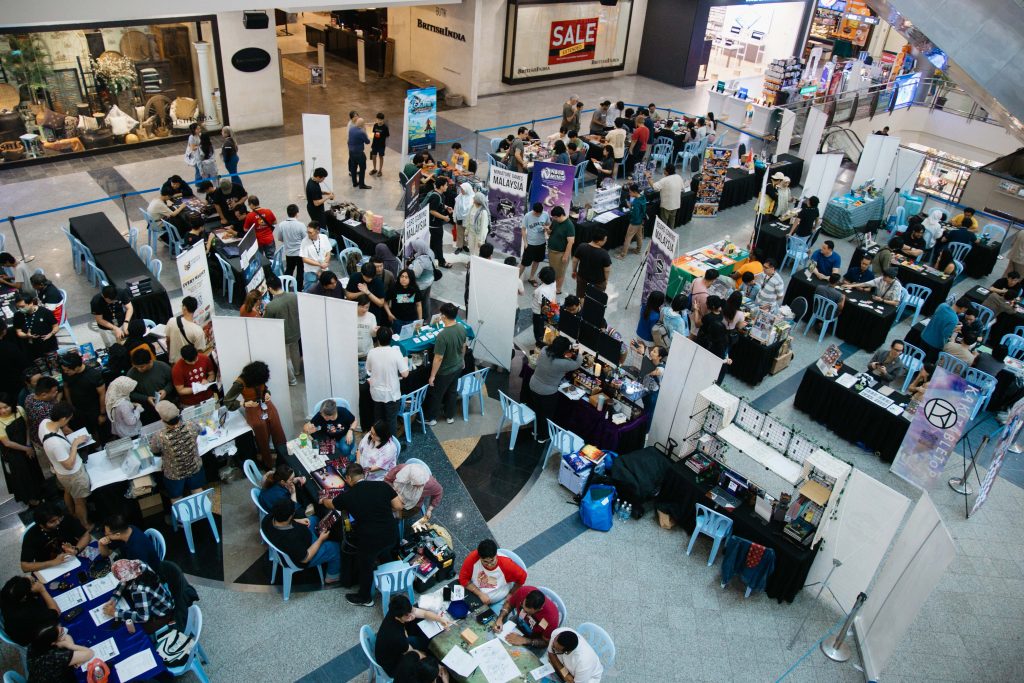
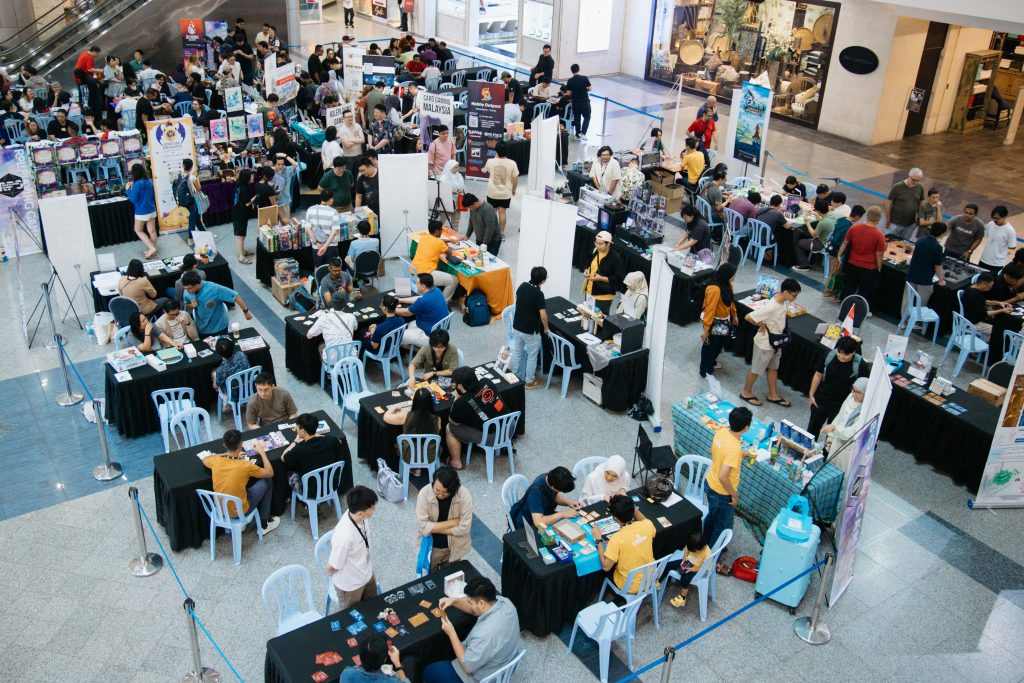
| Conversion: Event Footfall | ~4,000 |
overall Marketing funnel performance report.


| ITTDMY Post-Pandemic | impression Rate | Engagement Rate | Conversion Rate | CPM | CPE | CPA |
|---|---|---|---|---|---|---|
| 2024 | 292% | 0.76% (0.37% vs. Av.) | 0.37% (0.45% vs. Av.) | RM1.30 | RM0.50 | RM1.02 |
| 2025 | 188% | 3.82% (2.69% vs. Av.) | 4.17% (3.35% vs. Av.) | RM2.96 | RM0.15 | RM0.13 |
| AVERAGE | 280% | 1.13% | 0.82% | |||
| SLOPE | -104% | 3.06% | 3.80% | 166.39% | -35.13% | -114.96% |
| Analysis | 📉 downtrend: with smaller ad budgets, ad algorithm cannot sufficiently saturate target audience. (Reach volume of 2025 is 1X% of 2024’s, ad spend was 2X%) | 📈 uptrend: retargeting audiences & lookalikes from accumulated data helped with engagement rates. | 📈 uptrend: retargeting audiences & lookalikes from accumulated data helped with engagement rates. | 📉 downtrend: 2024 CPM lower, due to Seasonality (school holidays from May 24 till June 2) while 2025’s was almost a fortnight before school holidays (from May 29 till June 9.) 2025 dates were chosen to avoid clash with Eid al-Adha (Hari Raya Aidiladha / Haji)) | 📈 uptrend: higher efficiency indicated by falling cost in driving audience engagement. (Retargeting audiences & lookalikes from accumulated data helped) | 📈 uptrend: higher efficiency indicated by falling cost in driving leads acquisition. (Retargeting audiences & lookalikes from accumulated data helped) |
| ITTDMY Pre-Pandemic | impression Rate | Engagement Rate | Conversion Rate |
|---|---|---|---|
| 2019 | 75.0% | 50.0% | 25.00% |
| 2021 | 144% | 19.8% | 0.80% |
| AVERAGE | 144% | 19.8% | 0.81% |
| SLOPE | 34.6% | -15.1% | -12.1% |
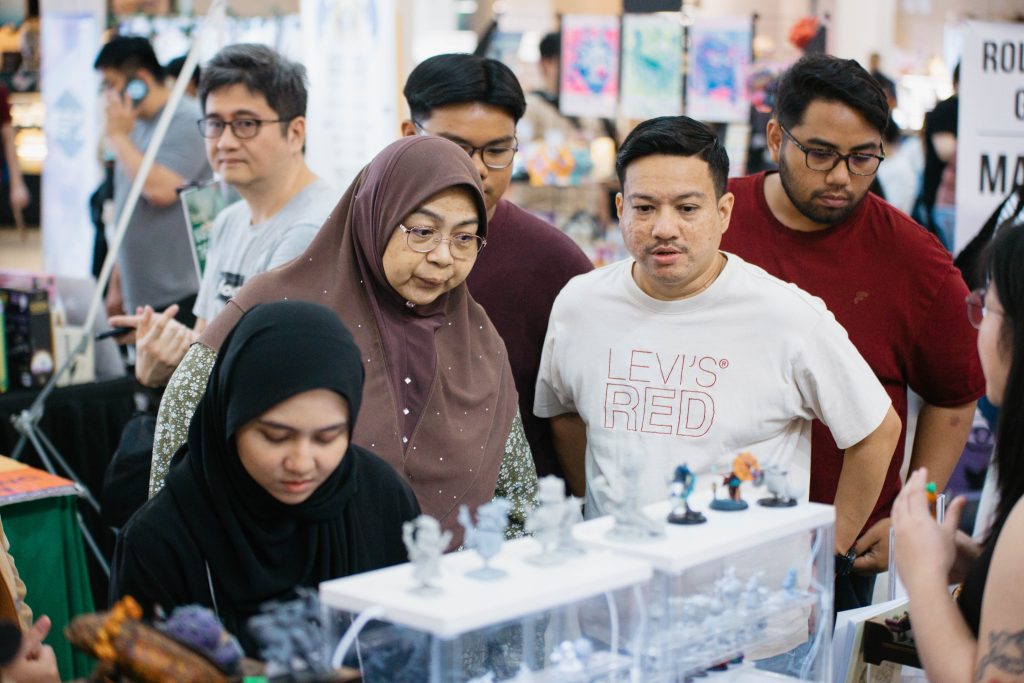
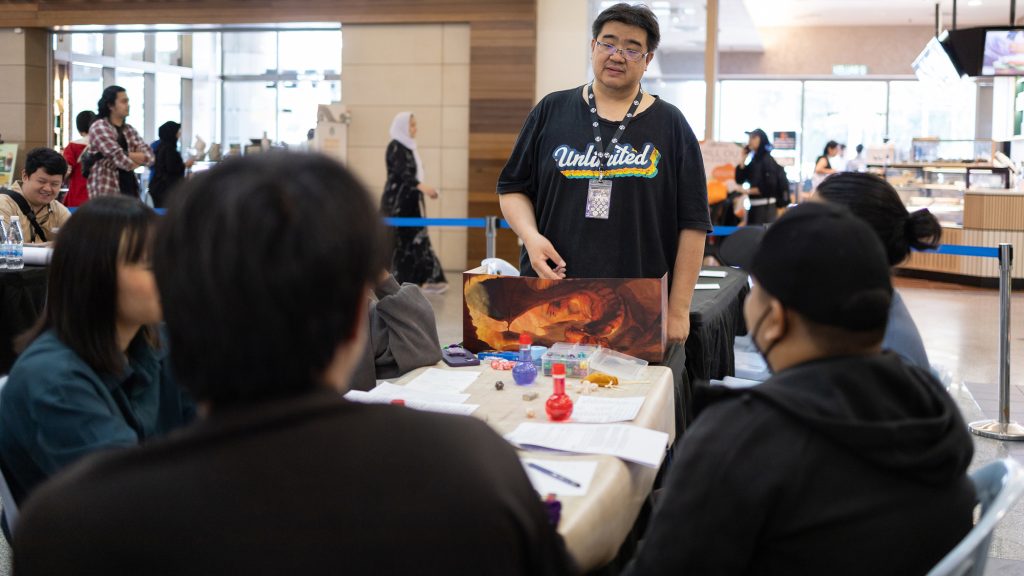
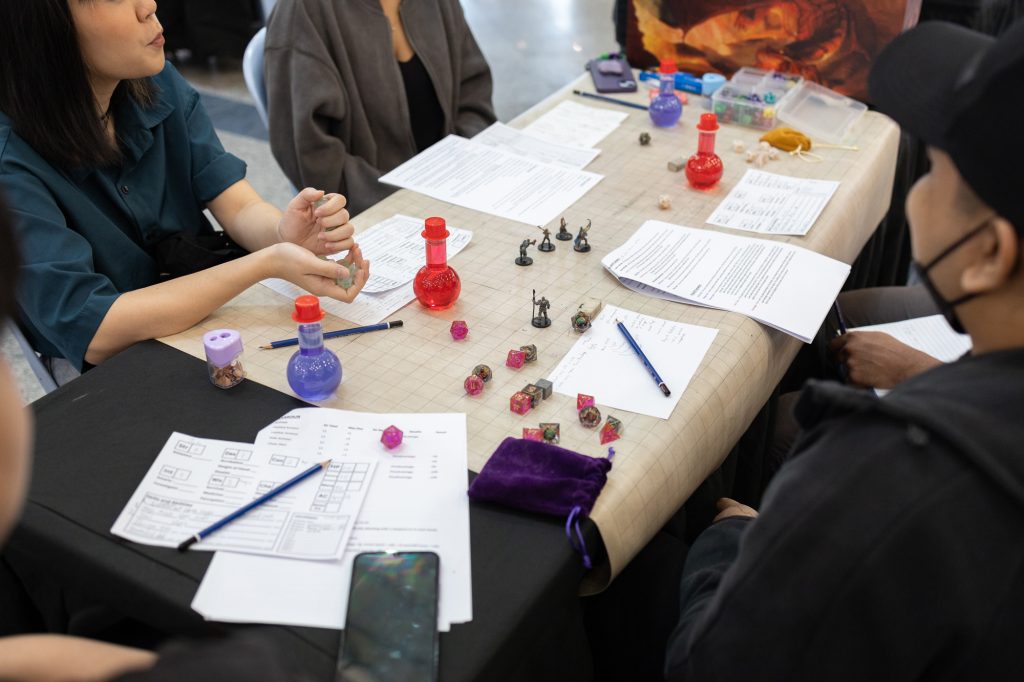
| Analysis | 📈 uptrend: going beyond a single-venue series, to a national-level event (streaming, due to pandemic lockdowns.) | 📉 downtrend: Engagement halved; audiences aren’t driven by sales pitches (but want to meetup and play.) | 📉 downtrend: engagement rate drop is less than conversion rate drop (indicates mismatch of expectations.) |
Key differences between pre vs. post Pandemic ITTDMY series
- Public venue, instead of merely online or private venues.
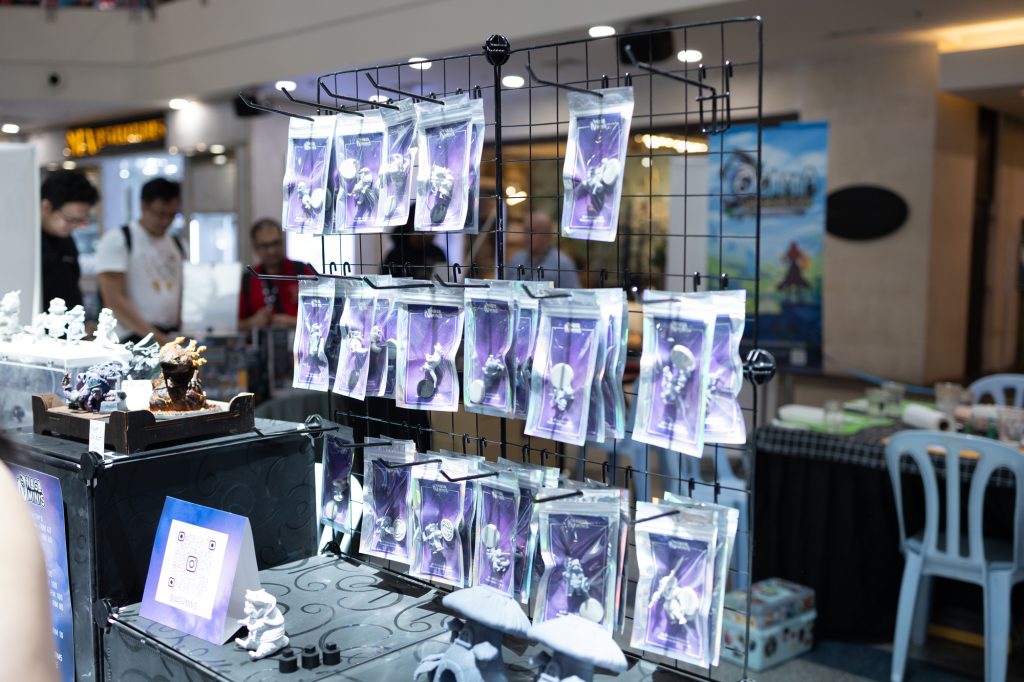
- Curated vendors and sponsors, instead of free-for-all / open-for-application.
- Open to the general public, instead of ethnolinguistic marketing: EN & MS
- Paid social media & full-funnel digital marketing, for target audience saturation.
- Years-long build-up: small meetups over the years, cascading into one big event.
| Year | Tabletop Convention |
|---|---|
| 2005 | GameCon-1 |
| 2006 | |
| 2007 | |
| 2008 | |
| 2009 | |
| 2010 | |
| 2011 | MaGaCon 2011 |
| 2012 | MaGaCon 2012 |
| 2013 | |
| 2014 | |
| 2015 | KotakCon 2015 |
| 2016 | KotakCon 2016 |
| 2017 | |
| 2018 | |
| 2019 | MejaCon 2019 |
| 2020 | |
| 2021 | |
| 2022 | AniGames 2022 |
| 2023 | AniGames 2023, BoxCon 2023 |
| 2024 | ITTDMY 2024, BoxCon 2024, All Aboard 2024, ABGFMY 2024, Mejacon 2024 |
| 2025 | ITTDMY 2025, SNTC, ABGFMY 2025 |